
Built on evidence, not guesswork
Underpinned by global legislation, ISO45001, best practice, and international research, the Safe365’s Safety Culture Maturity Index gives you:
- Industry benchmarked maturity score
- 10 modules and 80+ specific health and safety areas, scored against ISO industry standards
- A clear, prioritised improvement roadmap with advised actions
- Task management, assignment, tracking and prioritisation
- Comprehensive suite of templates and guidelines
- Insights Centre, delivering engaging data visualisations
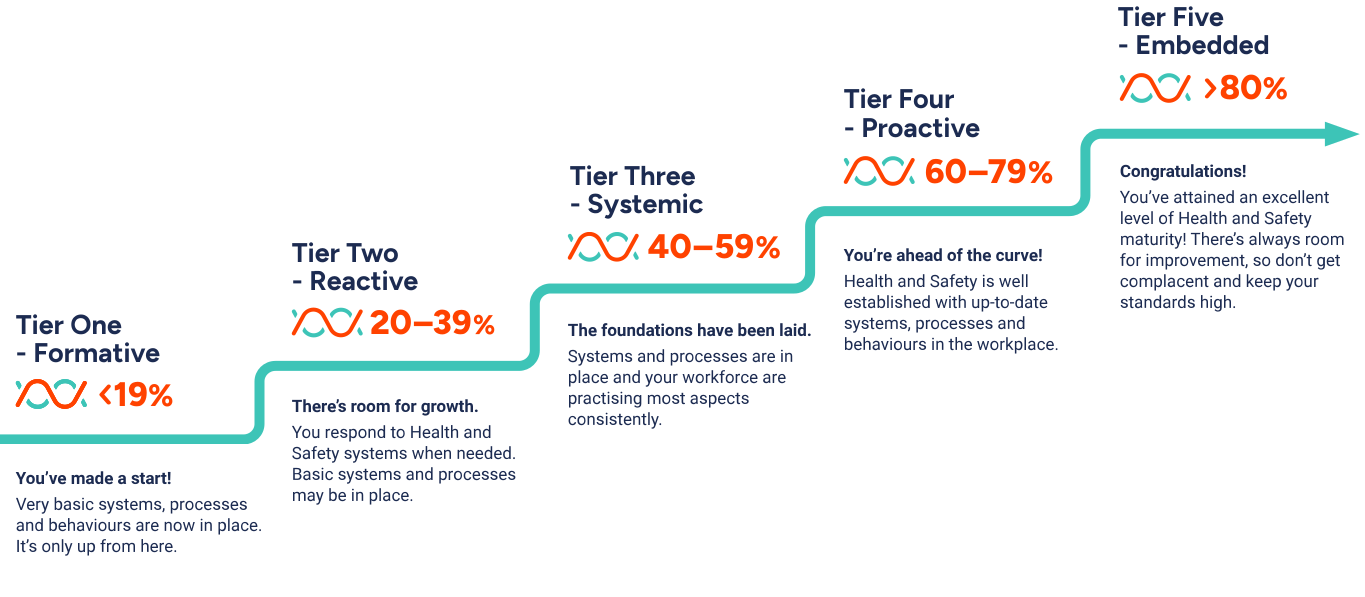
Climb your way to health and safety ‘Leadership’ status
More than a legal obligation, we show you what you need to do next to get there.
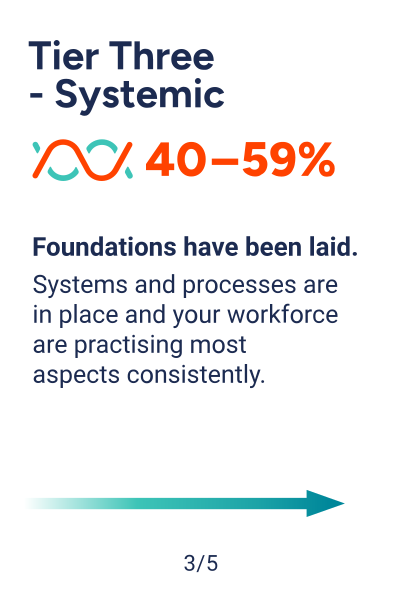
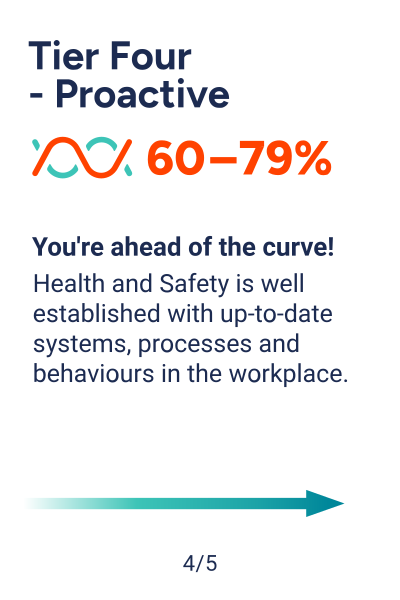
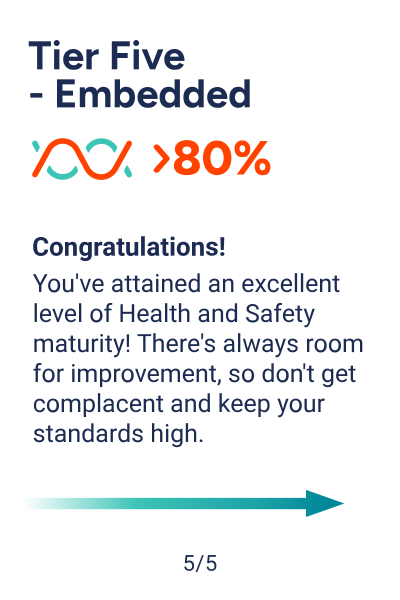
What’s your health and safety score?
The Safety Culture Maturity Assessment
Assess against global standards
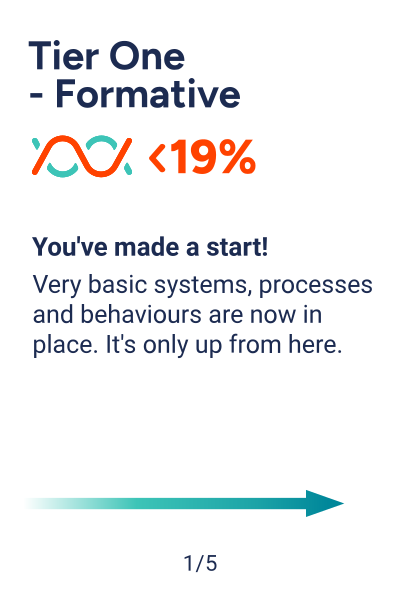
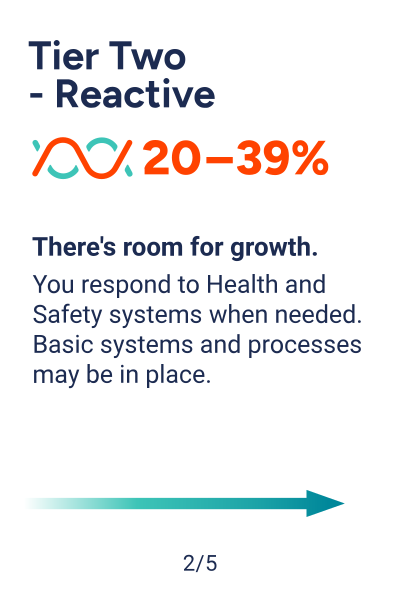
Complete your own assessment across 10 modules and 80+ specific health and safety areas, scored against ISO 45001 and global legislation. You get a single, clear Safety Index score: an instant snapshot of your strengths, your areas for improvement, and where you sit against the 54% global average.
Turn insights into action
- Get AI-generated summaries and recommended improvement pathways you can drop straight into your health and safety strategy, not just a list of gaps
- At element level, get specific guidance tailored to your industry, geography, size and current maturity, not generic best practice
- See the impact each improvement area has on your overall score, so you know what to prioritise first
- Build the plan: assign responsibility, timelines and priority by module or element
- Track everything on a live progress dashboard with real-time status on every task, ready to run your work-in-progress meetings from
Report with confidence
Board-ready reports with red/amber/green visualisations that make progress easy to digest at a glance. Access the market benchmark report and translate safety performance into business language every audience understands.
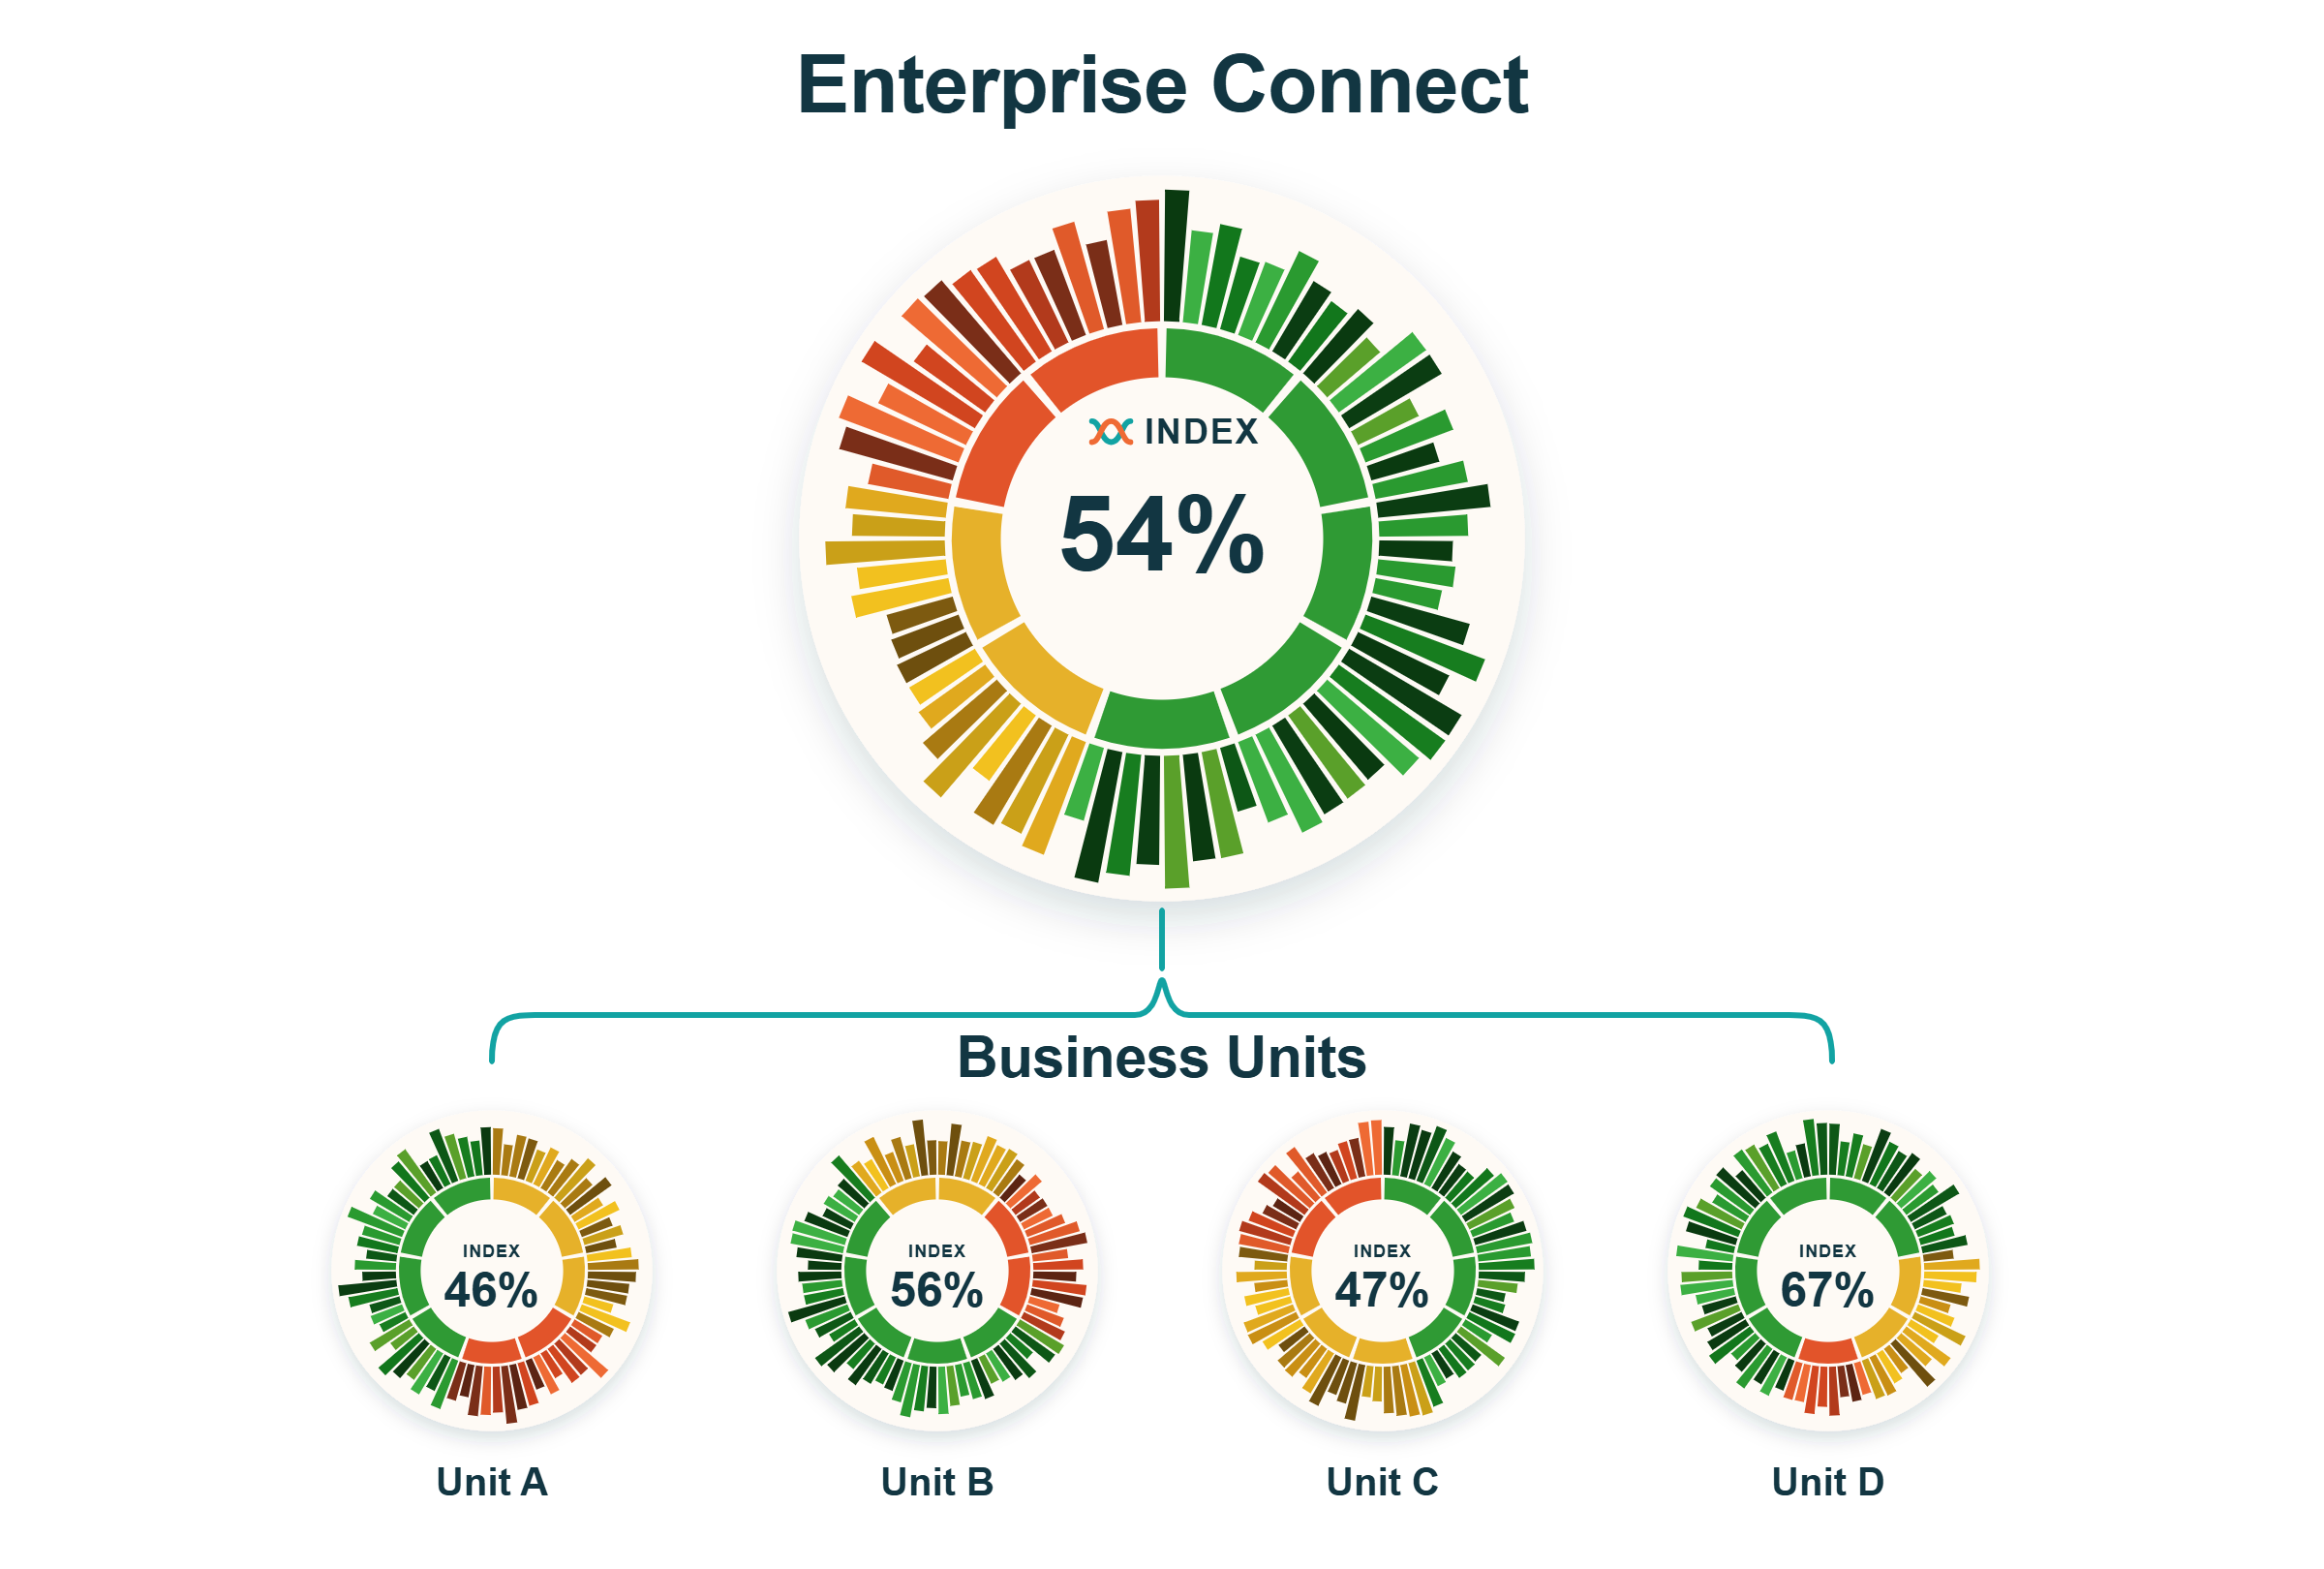
Scalable insight across complex environments and supply chains
Identify strategic strengths, uncover sub-cultures, and drive targeted continuous improvement across even the most complex operations and supply chains. Deepen sub-culture insight and support tailored action plans as needed.
Ownership and accountability at every level
Each business unit or contracting entity owns its own data and answers to it, driving individual action and focusing effort on real areas of weakness rather than top-down mandates. Leadership gets clear visibility of how to improve health and safety practice across every business unit and the wider supply chain.
A single, board-ready view
Roll every profile up into one aggregated ESG scorecard. Compare units side by side to see who’s leading and who needs support, track progress using both leading and lagging indicators, and give the board a single view to govern by, backed by the transparency and accountability that comes from measuring every part of the business the same way.
Real organisations, real maturity gains

How the City of London reframed safety as a vital part of management leadership.
The City of London Corporation used Safe365 to equip managers across its diverse departments with the tools and insight needed to lead safety with confidence and accountability.

Building a data-led strategy around safety culture improvement.
Wilson James uses Safe365 to gain real insight into safety maturity, giving divisions ownership of their data and enabling targeted, metrics-driven improvement plans.

Achieving department-specific insights and a pathway to safety excellence.
Birmingham Airport leverages Safe365 to gain a detailed view of safety culture across the airport and its key departments, reinforcing its strong commitment to safety.
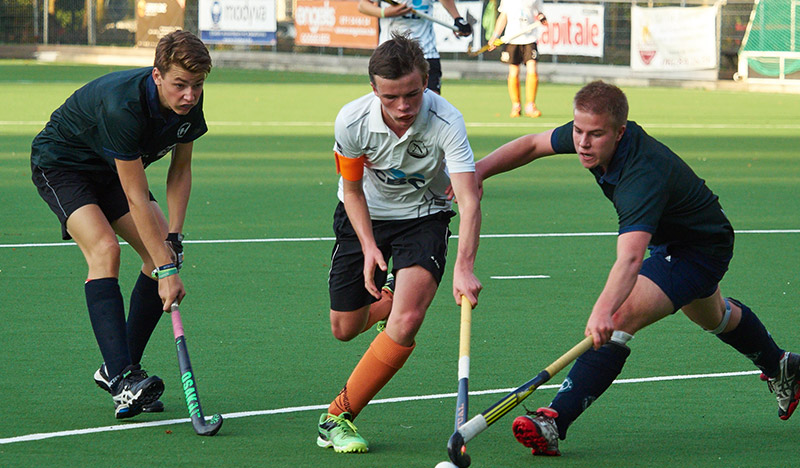
Shifting health and safety practice from compliance to culture
Hockey NSW data and maturity profiling to drive dramatic change in their health and safety practice enabling a jump in safety index from 45% to 62% in just 18 months
How Y Victoria moved beyond compliance to measure and strengthen safety culture across 6,000 staff
Y Victoria leverages Safe365 to benchmark safety culture maturity across a multi-site organisation to strengthen leadership, reduce harm and demonstrate performance to the board.

Establishing a benchmark for safety in equestrian sports
Committed to fostering a dynamic equestrian community and galloping towards data-driven safety decisions with a 30% increase in safety culture maturity.