")
Know where your health and safety risks manifest, how your organisation compares to the market and determine the strategic programmes of work needed to continually improve health and safety outcomes.

GAP ANALYSIS
Achieve a deeper understanding of health and safety maturity.
Benchmark current performance
- Assessments informed by global legislation and ISO standards
- Compare market performance against 9,000+ organisations
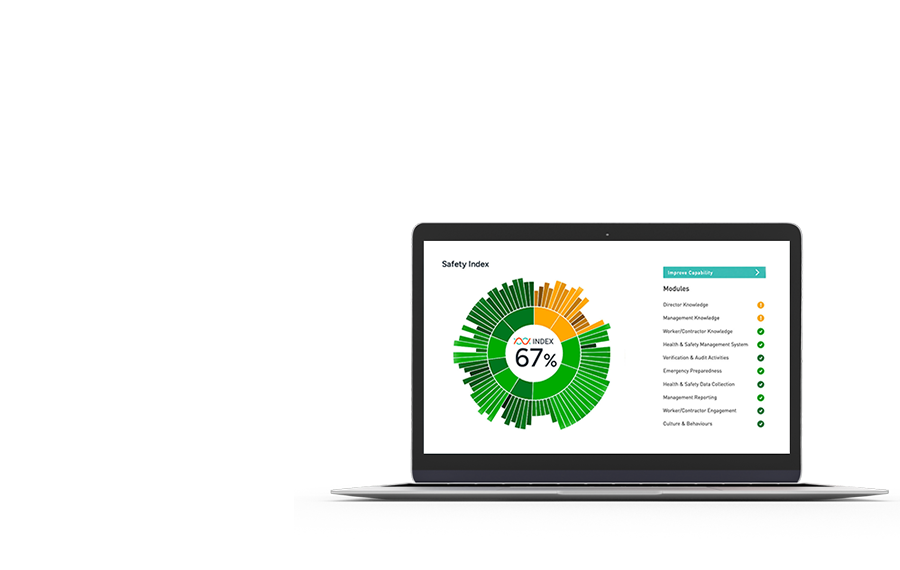
- Receive a rating of overall maturity – your Safety Index
Identify areas of strength and weakness
- Understand performance of health and safety practices across your organisation
- Uncover common themes or risk areas to address
- Recognise impact of individual improvement areas
Understand business unit variances
- Conduct assessments by business unit or region
- Compare performance to highlight leaders and laggards
- Aggregate performance to provide summary ESG scorecard
ACTION PLAN & DELIVERY
Create and activate a continuous improvement pathway.
Plan and prioritise strategic workstreams
- Prioritise action plans by maturity impact
- Build a comprehensive action plan and strategic roadmap
- Access ongoing enablement support and improvement resources
Build, manage and activate a comprehensive action plan
- Set targets, timelines and responsibilities by action
- Use task status and prioritisation to set agenda for WIP meetings
- Filter and search tasks quickly to target review needs
Drive ownership and accountability
- Provide team wide visibility via maturity dashboard
- Get real time alerts of task status, assignment and deadline pending

TRACK, MEASURE, REPORT
Drive real-time assurance of ESG impact and safety practice improvement.
Translate safety language into business language
- Generate impactful reports using PowerBI integration
- Present easy-to-digest data visualisations of progress using red, amber, green classification
Compare business performance internally and against the market
- Access market benchmark report
- Breakdown data by business unit or region